SERVICES
DATA BENCHMARKING OR SEO PERFORMANCE METRICS
The Importance of Data Benchmarking: A Strategic Approach
Data benchmarking or SEO performance metrics is a critical process for businesses striving to maintain a competitive edge in today’s fast-paced market. It involves comparing your business’s performance metrics with industry standards or competitors to identify areas for improvement. This powerful strategy provides valuable insights that can help optimize operations, enhance decision-making, and drive growth.
When I do data benchmarking, I compare my performance metrics with industry standards or competitors to see where I stand. First, I gather my own data, like sales or productivity numbers, then find benchmarks from reliable sources to see how I’m doing in comparison. This helps me identify areas where I can improve or confirm if I’m on the right track. From there, I develop strategies to close any gaps and keep an eye on progress to make sure I’m staying competitive.
Click the image for a better view
Google Analytics Data
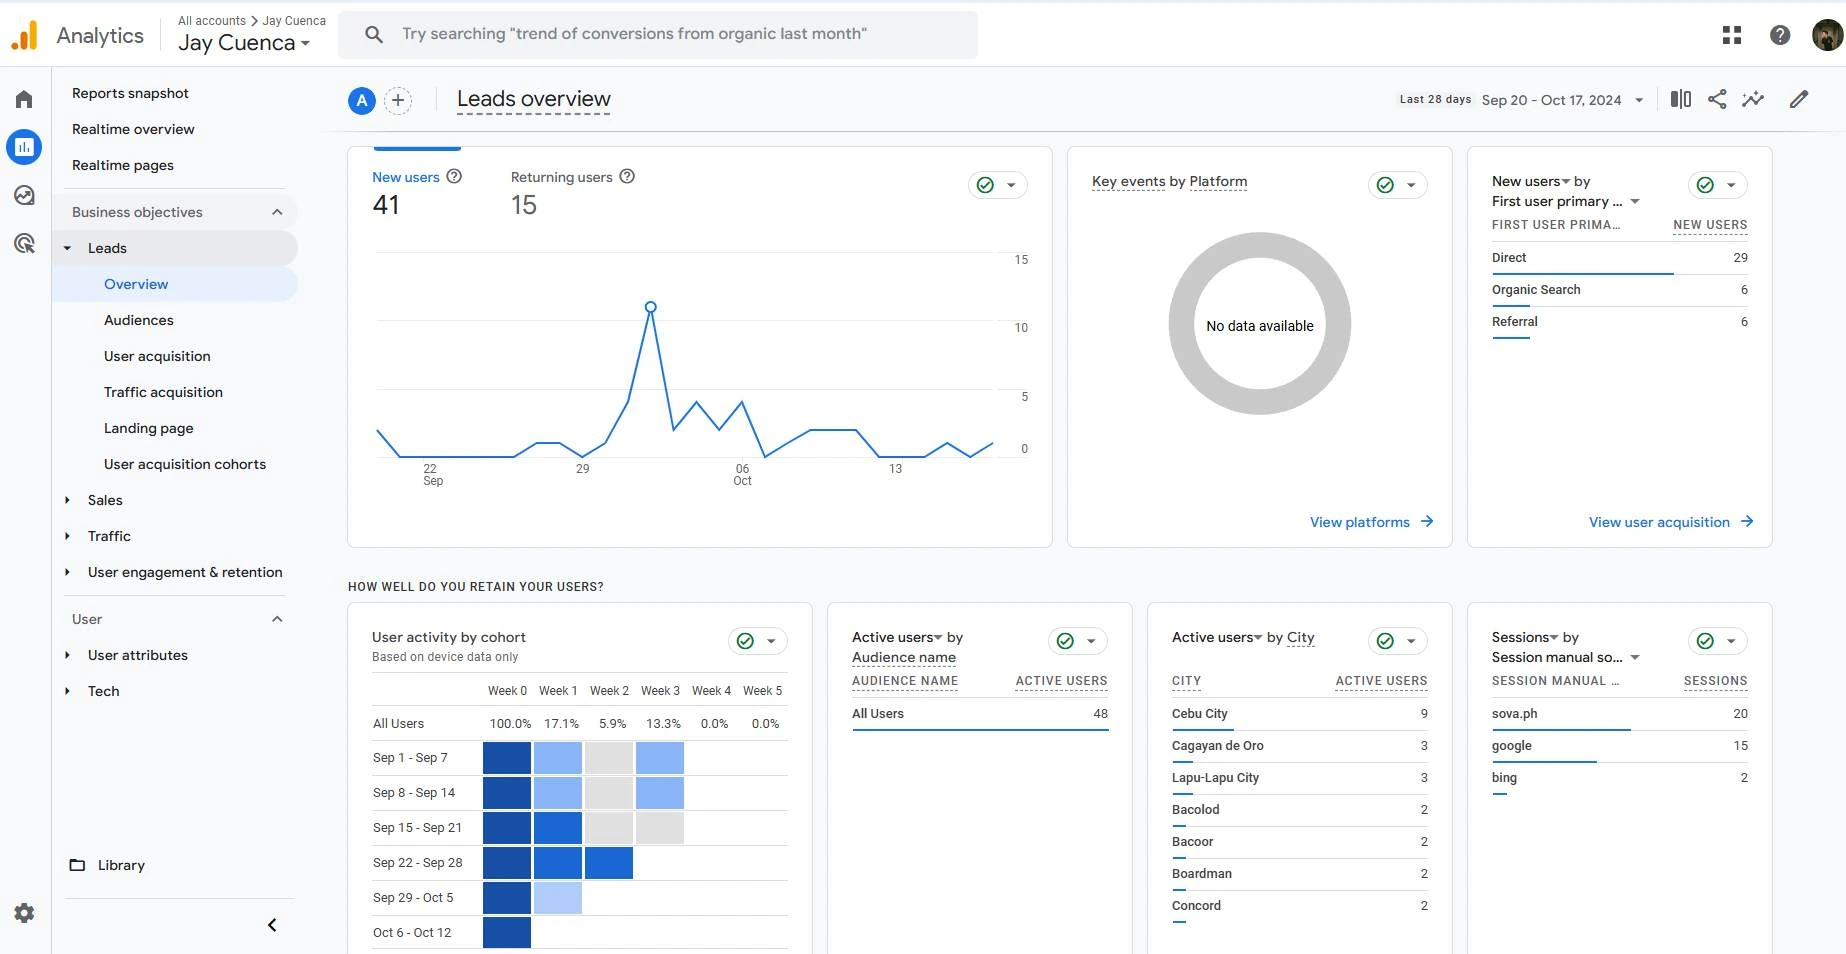
Over the past 28 days, my website has attracted 41 new users and 15 returning users. This is a good sign because not only am I bringing in fresh traffic, but I’m also keeping some of my previous visitors engaged. It’s nice to see a balance between new and returning users, as it means my site is getting attention from first-time visitors while still offering value to those who’ve been here before.
When I looked at my traffic sources, I noticed that most of my new users (29) came from direct traffic. This likely means they typed my website URL directly into their browser. Six users came through organic search, which tells me that my SEO efforts are working but could probably use a boost to bring in even more organic traffic. I also had six users coming from referrals, meaning they were directed to my site from other websites.
The user activity by cohort section is interesting because it shows how well I’m retaining users over time. The chart reveals that my site had the most engagement from September 22 to October 5. For example, 13.3% of users from the week of September 29 were still active in the second week, though that dropped to 5.9% by week three. This tells me that while I’m retaining some users, there’s room to improve on keeping them engaged longer.
Geographically, most of my active users are based in Cebu City (9 users), with a few others from places like Cagayan de Oro and Lapu-Lapu City. Knowing this is helpful because it gives me an idea of where my audience is coming from, and I can potentially tailor my content or marketing efforts to these areas.
Overall, the data gives me a pretty clear picture of how my site is performing and what areas I can focus on to improve.
Google Search Console Data
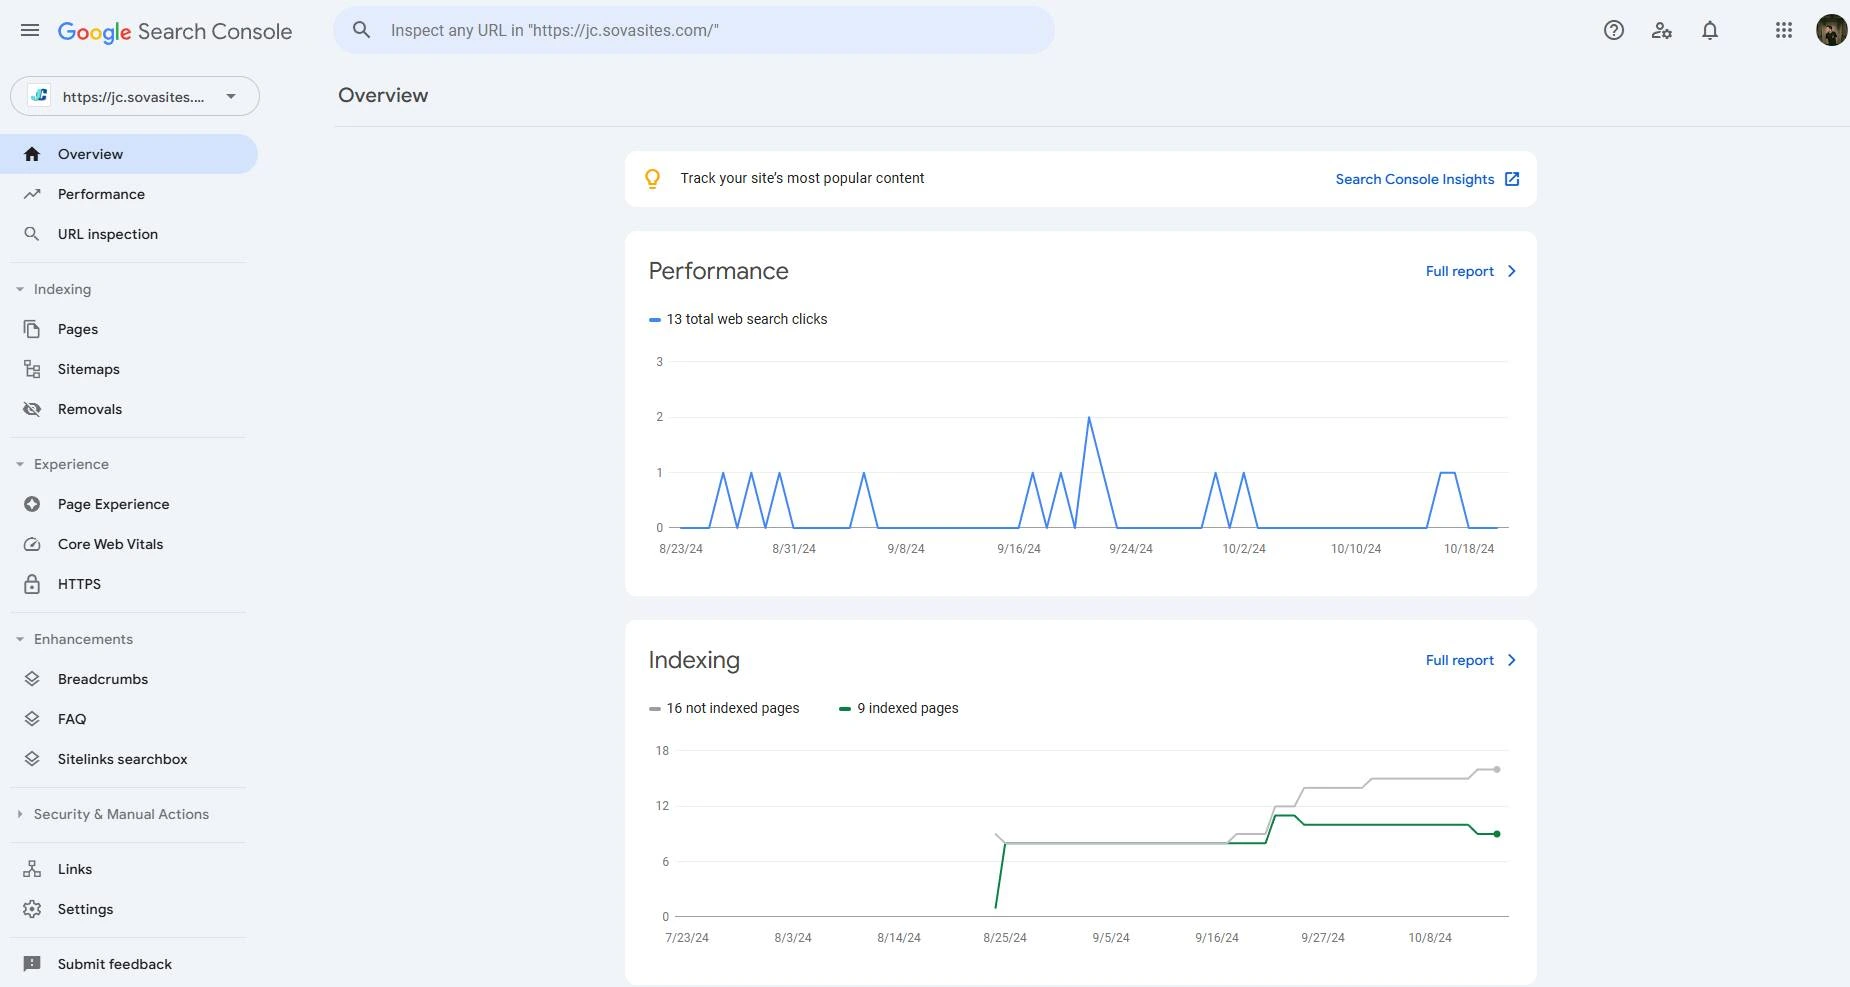
Looking at my Search Console dashboard, I can see that I’ve had a total of 13 web search clicks during the selected time period. The performance graph shows some fluctuations in the number of clicks, with peaks happening around late September and early October. It seems like I had the most activity around September 24, when I got a couple of clicks in a single day. However, the number of clicks has been quite minimal, and there were several days without any clicks. This tells me that while my site is getting some traffic from Google, there’s still a lot of room for improvement in visibility and search performance.
Next, the Indexing section provides me with more insights. As of now, 9 pages from my site have been indexed, while 16 pages haven’t been indexed. The indexed pages are the ones Google is currently showing in search results, meaning they’re crawlable and visible to users. The non-indexed pages, on the other hand, aren’t yet appearing in search results, which could be due to various reasons like crawl errors, content quality, or the pages being blocked by robots.txt or set to “noindex.” It’s important for me to review those unindexed pages and see why they aren’t being indexed because getting more of my site’s content into Google’s index would improve my chances of ranking higher in search results.
Overall, while the performance is steady, I need to work on improving my click-through rate and resolving any indexing issues to boost my site’s visibility on Google. This could involve enhancing my SEO efforts, optimizing content for targeted keywords, and making sure my site is fully crawlable by search engines.

Here are five reasons why data benchmarking is essential:
- Identifies Performance Gaps
Data benchmarking highlights discrepancies between your business performance and industry benchmarks. This allows you to pinpoint areas where your operations may be lagging, giving you a clear roadmap for improvements.
2. Encourages Continuous Improvement
Regular benchmarking motivates businesses to continuously improve and innovate. By constantly comparing your performance to industry leaders, you can stay ahead of market trends and enhance your services or products.
3. Informs Strategic Decision-Making
With accurate benchmarking data, you can make informed decisions based on real-world metrics. This ensures that strategic initiatives, such as marketing campaigns or operational changes, are based on reliable data rather than assumptions.
4. Boosts Competitiveness
Data benchmarking allows you to see how you stack up against competitors. By understanding where you excel and where you fall short, you can fine-tune your strategy to gain a competitive advantage in the marketplace.
5. Enhances Customer Satisfaction
By identifying areas for improvement through benchmarking, you can better meet customer needs and expectations. Whether it’s product quality, service speed, or customer support, continuous benchmarking leads to better customer experiences.
In conclusion, data benchmarking is a powerful tool for businesses that want to stay competitive, improve operations, and enhance customer satisfaction. Implementing a data benchmarking strategy not only helps in achieving short-term goals but also lays the foundation for long-term success.
As an SEO specialist, using Google Analytics and Google Search Console for data benchmarking provides a comprehensive view of your website’s performance and user behavior. Google Analytics allows you to track detailed user metrics, such as traffic sources, audience demographics, and user engagement. It helps you understand how visitors interact with your site, what content is performing well, and where improvements are needed to enhance user experience and conversion rates.
On the other hand, Google Search Console gives you insights into your site’s presence on Google Search. It helps monitor your website’s indexing status, identifies any crawl issues, and shows how well your site is ranking for various keywords. By analyzing the search clicks, impressions, and the number of indexed pages, you can identify areas for improvement in SEO and ensure that your content is optimized for search engines.
Together, these tools empower you to make informed, data-driven decisions that enhance your SEO strategy, improve website visibility, and optimize user experience. They provide actionable insights that guide your efforts to increase organic traffic, improve keyword rankings, and ultimately drive better results for your site.
Do you want your business to generate more sales?
Get started today and boost your results. Click the button now!


